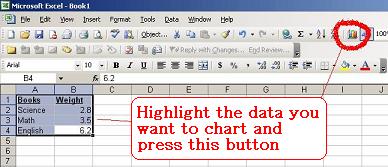
Making a chart in excel can be really easy. The computer does most of the work for you. You do have type in the data though. In the example below we typed in a simple table of data concerning text books and their weight in pounds.
To chart the data simply highlight all the data and then click the Chart Wizard button on the toolbar. The Chart Wizard will take you through several simple windows that will help you get the chart of your dreams.
The Chart Wizard will take you through a 4 step process:
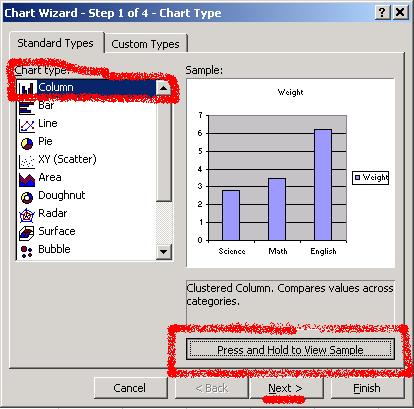
You start by choosing the chart you want. Then you confirm that the chart contains the correct data. Then you add more detail like the titles and legend. Finally you choose where to place your finished chart:
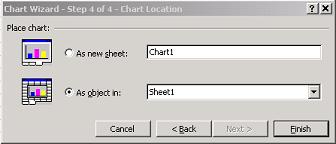
If you select "As new sheet" your chart will appear on its own page. If you select "As object in" it will appear in the worksheet where the data is.
When you're done click "Finish" to see you chart:
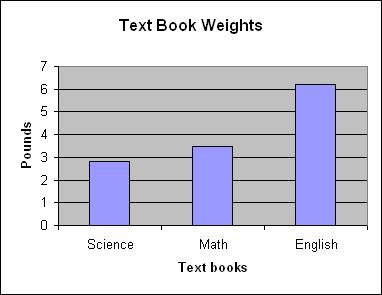 |
PRACTICE ACTIVITY: Try making a simple chart like the one above using the Chart Wizard in Excel.
TO KEEP ON LEARNING: To learn more about making charts in Excel try searching the internet for:
Chart wizard
Graphs and charts in Excel Charting Data Excel 2000 |
Making a chart in Excel
2:35:00 PM
0
Tags